Learn agentic AI in chemical manufacturing
Five hands-on exercises, starting easy and increasing in difficulty. No coding experience required.
Before you start: set up your AI tool
Get ready for any exercise.
Use a desktop or laptop for these exercises. Follow Claude Code for the same setup as my walkthroughs, or choose Codex below.
Download the app and sign in with a plan that includes Claude Code. Claude Code is built into the desktop app.
Open the Code tab and choose the folder containing your exercise files. Each exercise below tells you which files to download.
Follow the numbered steps in your chosen exercise. Read permission requests before approving installations or file changes.
Download the app and sign in with your ChatGPT account. Check that your account has Codex access.
Choose Codex, start a new chat, and open the folder containing your exercise files. Each exercise below tells you which files to download.
For the PFD exercise, ask Codex to read skills/pfd-generator/SKILL.md and follow it. For /setup or /simulate, ask Codex to read and adapt the repository instructions; these commands are written for Claude Code.
My walkthroughs use Claude Code. It’s the most direct way to follow along. Codex can tackle the same exercises, but the setup may differ.
New to GitHub? Here’s how to get the files.
Open the linked repository, click the green Code button, then Download ZIP. Extract the ZIP and open that folder in your AI tool. You don’t need to clone a repository or write any code.
Need Python or a missing package? Paste the error into Claude Code and ask it to fix the project setup, then rerun the failed step.
Tip: change the model and effort for better results
Both Claude Code and Codex let you choose the model and the effort level from the menu next to the prompt box. These two settings make a noticeable difference on the harder exercises.
- Model. Stronger models, such as Opus or Fable in Claude and Astra in ChatGPT, handle complex, multi-step tasks better.
- Effort. Raising effort to high, extra high, or max gives the model more time to reason before it acts.
Keep in mind that a stronger model at higher effort uses up your plan’s usage limits faster. Feel free to change the model/effort at any time during the exercises if you want better results.
01Create a process flow diagram
BeginnerDescribe a chemical process in plain English and get an editable PFD.
 Open full size
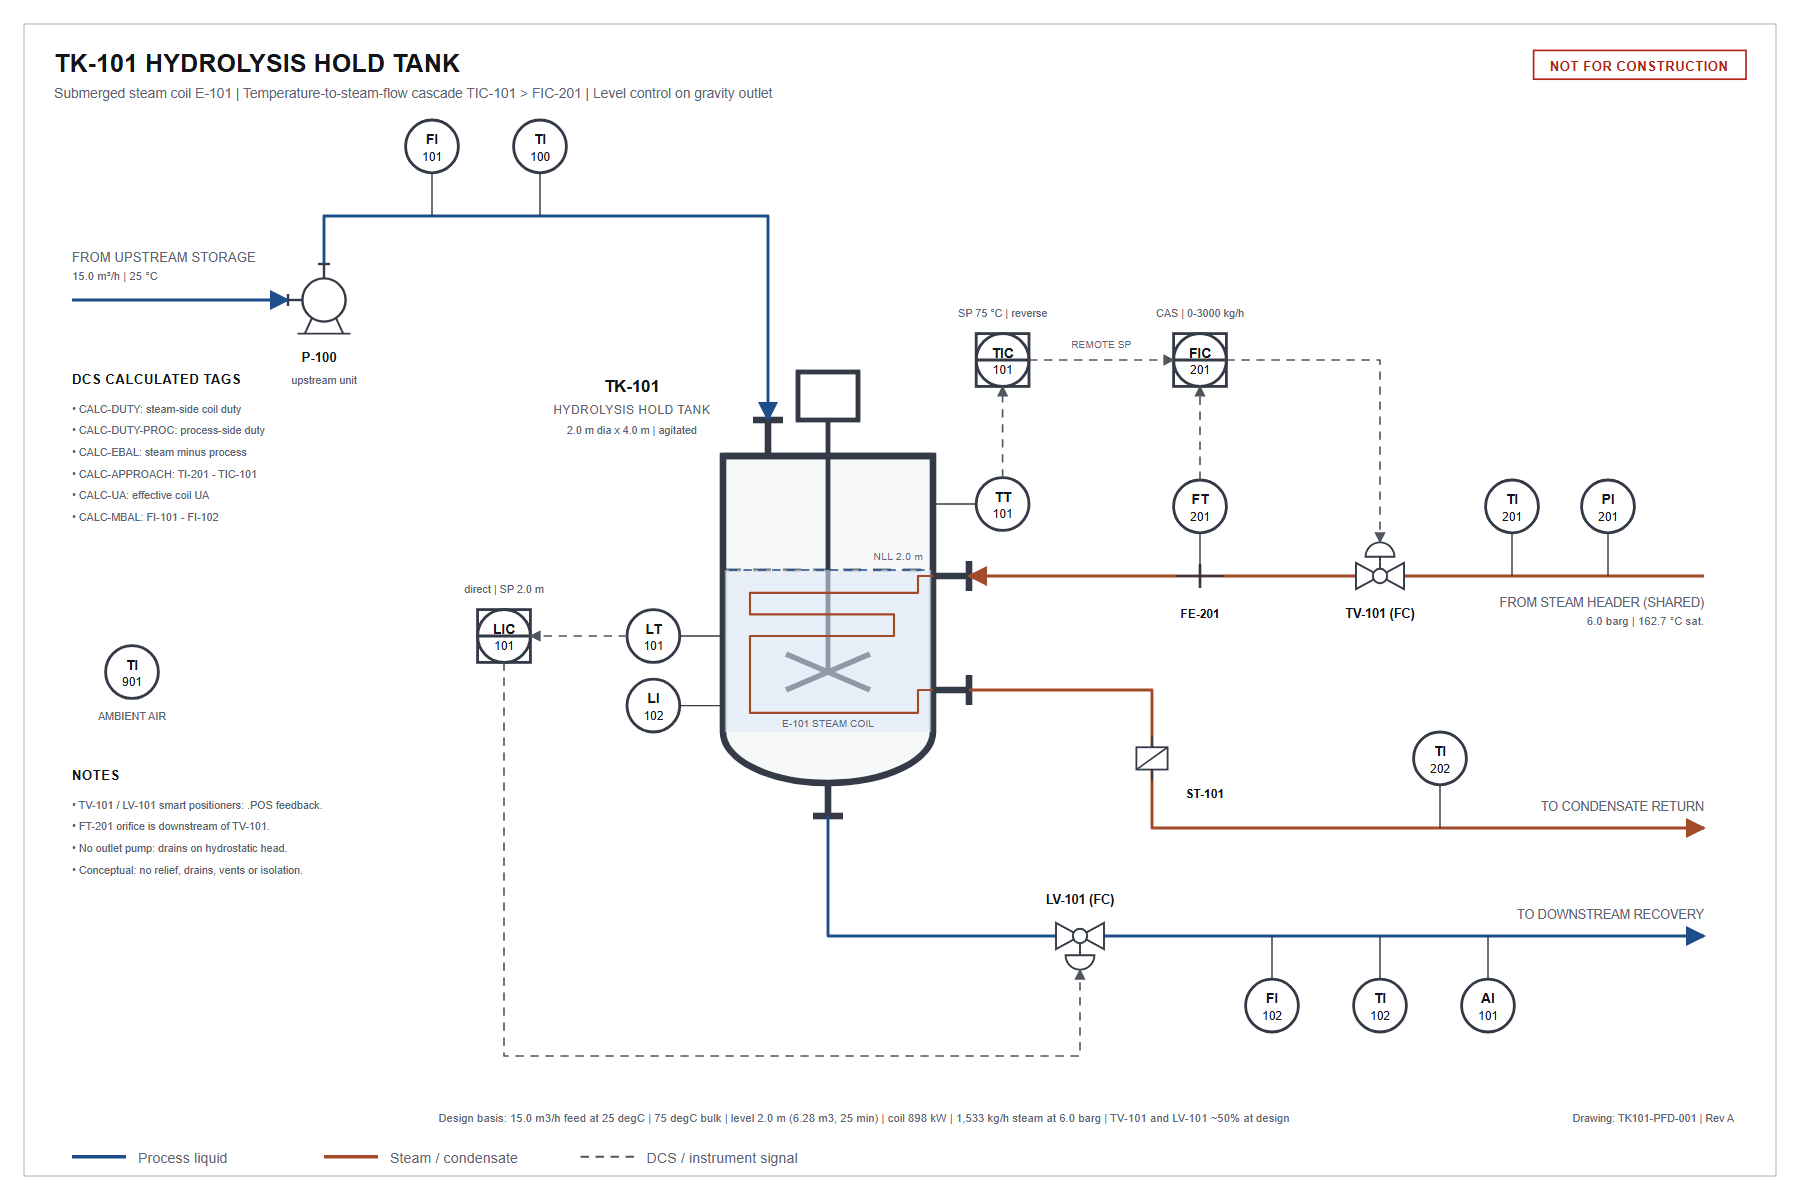
What we’ll do: turn a process description into a PFD, then revise it.
What you’ll get: an editable PFD you can open in your browser.
Key new terms
Skill: a reusable set of instructions and supporting files that guides AI through a specific task. My PFD skill tells Claude how to draw and check the diagram.
- Download the files and open them in Claude Code. Go to my Claude PFD Generator repository, click Code → Download ZIP, and extract the ZIP. In Claude Code, open the extracted folder containing
skills/pfd-generator. - Create your first PFD. Paste this prompt into Claude Code. Replace the process description with your own if you’d like.Draw the PFD · Paste into Claude Code
Create a PFD of a continuous, steam-heated, agitated tank with temperature and level control. A pump feeds liquid into the tank from upstream storage. Tank temperature is controlled by a cascade loop: the temperature controller sets the target for a steam flow controller, which throttles the steam valve feeding the tank’s internal heating coil. Tank level is controlled by a valve on the gravity-drained outlet line.
- Review the drawing. It should look something like the PFD at the top of this exercise, but it won’t be exact. Make any changes you feel are necessary by giving feedback to AI in plain English.
- Save the skill for future use (optional). If you want to reuse this PFD generator in the future, add it as a Skill to your desktop app. To do this, paste the following into your current Claude Code chat:Install the skill · Paste into Claude Code
Copy the entire skills/pfd-generator folder, including its scripts and references, into ~/.claude/skills/pfd-generator in my home folder. Create the skills folder if needed so I can use /pfd-generator in any local Claude Code project.
Once installed, start a new local chat in the desktop app’s Code tab. Type
/pfd-generator(called a slash command), followed by a description of your chemical process, and Claude will generate the PFD. You can use it from any working folder on this computer. You don’t need to reopen the downloaded project folder.
02Extract information from a P&ID
BeginnerTurn equipment, instruments, and their connections into structured data.
 Open full size
 Open full size
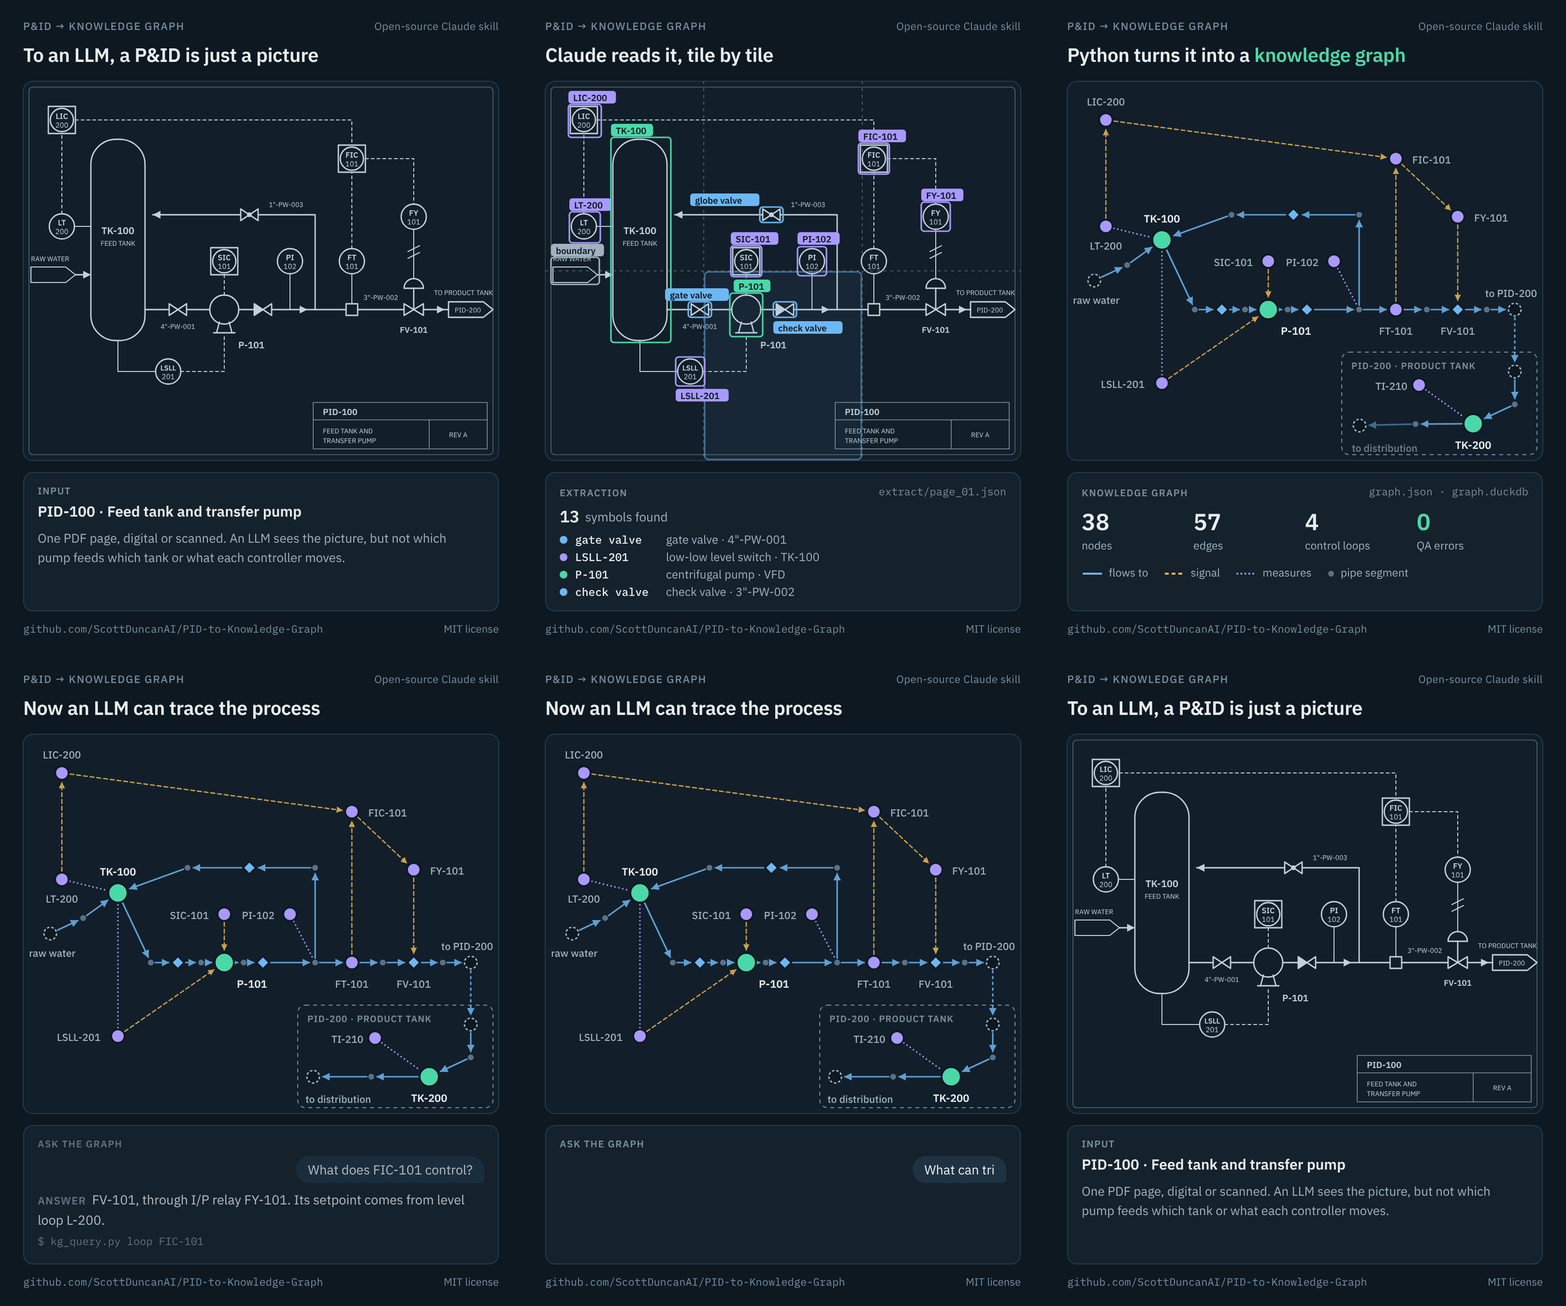
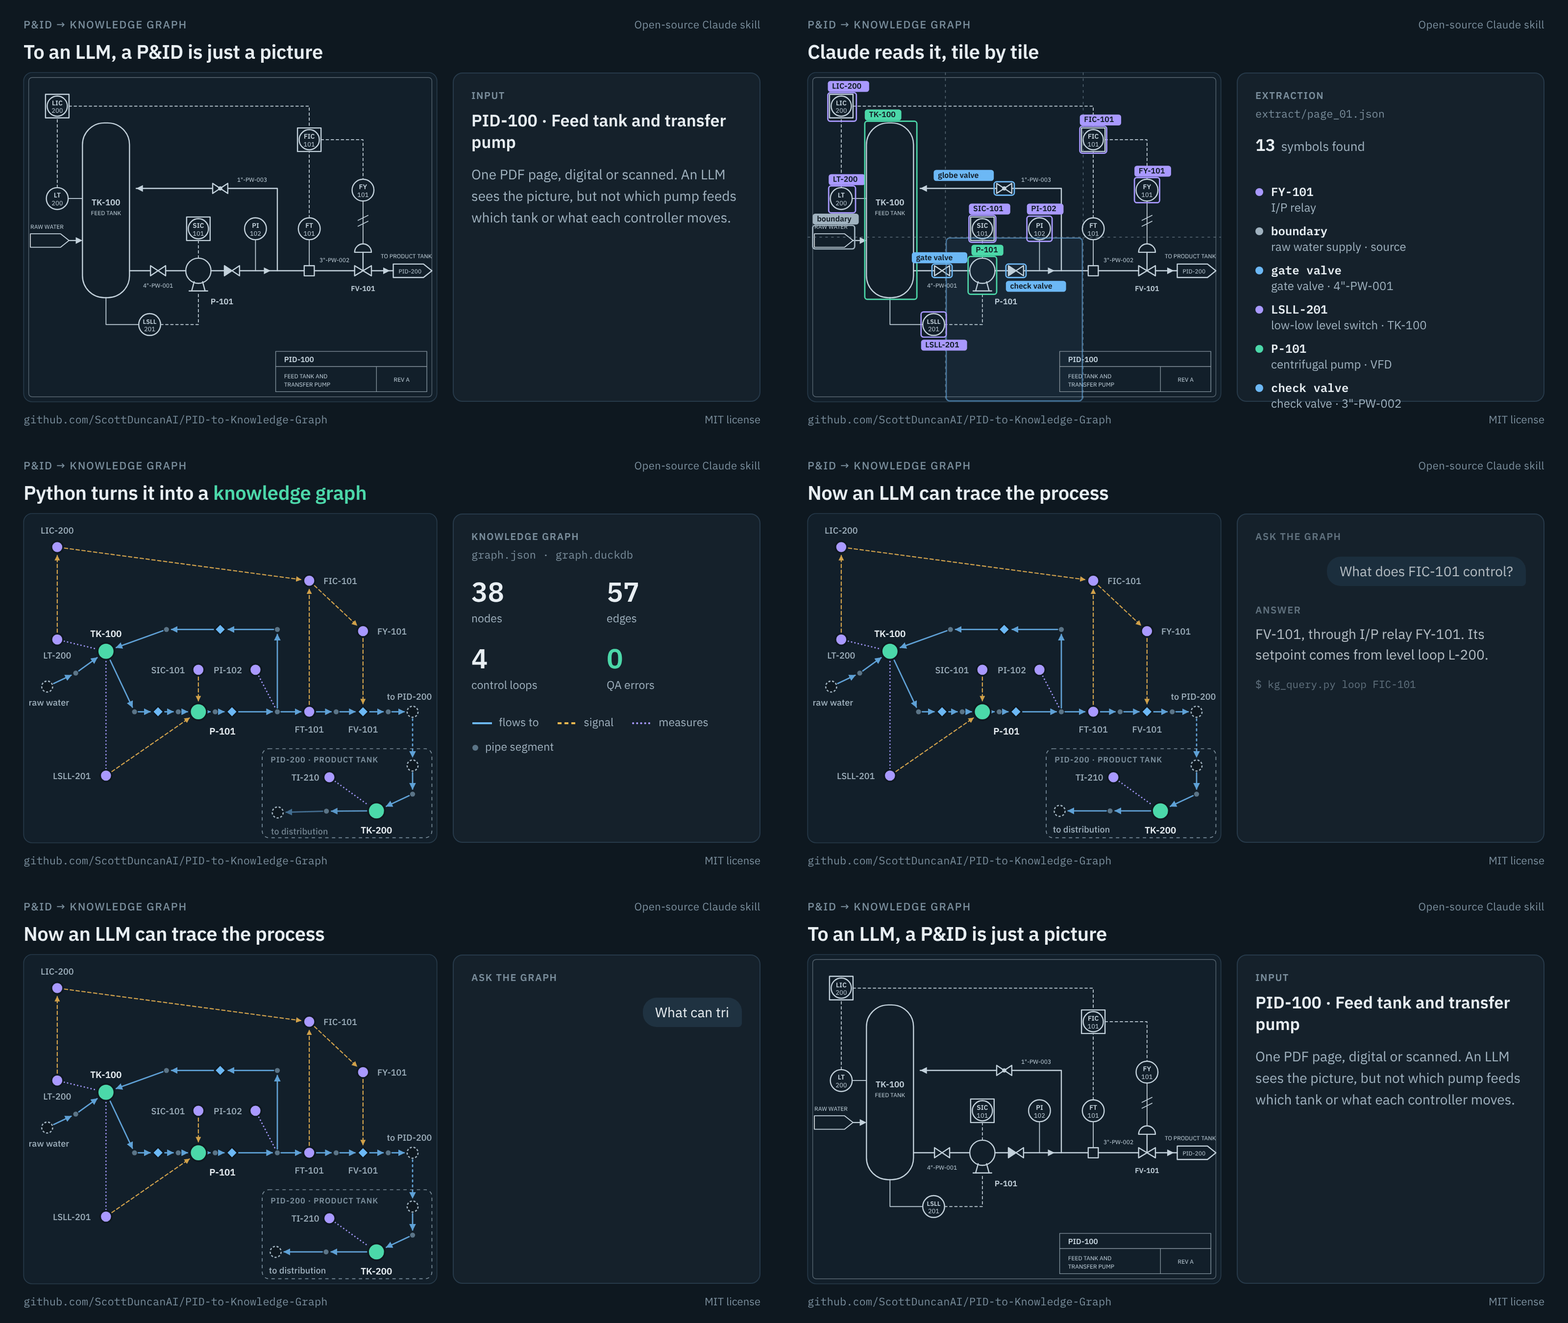
What we’ll do: use my P&ID converter skill to extract equipment, instruments, and connections from one drawing page.
What you’ll get: a knowledge graph, a readable process summary, and a report of items to review.
Key new terms
Skill: reusable instructions and files that guide AI through a task.
Knowledge graph: a structured map of items and their relationships, such as which instrument measures a tank’s temperature.
- Download the converter skill. Open my P&ID to Knowledge Graph repository, click Code → Download ZIP, and extract it. Open the extracted folder in Claude Code. The skill requires Python 3.10 or newer; the README recommends Python 3.12.
- Add a P&ID to that folder. Download one PDF from the P&ID section of my public dataset collection and put it in the folder you opened in Claude Code. Claude will identify a drawing page to use.
- Convert the drawing. Paste:Run the converter · Paste into Claude Code
Read skills/pid-to-kg/SKILL.md and follow its instructions to convert the P&ID PDF in this folder into a knowledge graph. If the PDF contains multiple pages, start with the first legible P&ID sheet and tell me which page you selected. Help me set up any required Python packages. Summarize what you found, flag anything uncertain, and tell me where to open summary.md and qa_report.md.
- Review the graph against the drawing. Open the summary and review report at the locations Claude provides. Compare the extracted equipment, instruments, and connections with the drawing. Tell Claude which entries to correct, then ask it to rebuild the graph if needed. The saved graph files are
graph.jsonandgraph.duckdb. - Save the skill for future use (optional). If you want to reuse this P&ID converter in the future, add it as a Skill to your desktop app. To do this, paste the following into your current Claude Code chat:Install the skill · Paste into Claude Code
Copy the entire skills/pid-to-kg folder, including its scripts and references, into ~/.claude/skills/pid-to-kg in my home folder. Create the skills folder if needed so I can use /pid-to-kg in any local Claude Code project.
Once installed, start a new local chat in the desktop app’s Code tab. Type
/pid-to-kg(called a slash command), followed by the P&ID PDF you want to convert, and Claude will build the knowledge graph. You can use it from any working folder on this computer. You don’t need to reopen the downloaded project folder.
Why create a knowledge graph?
A knowledge graph gives the AI a working picture of how your process fits together. What feeds what, which instrument measures which vessel, where each control loop sits. That structure is the context it needs to troubleshoot a process issue.
Without it, the AI has tag names and numbers and nothing else. It can tell you that a value moved. It cannot tell you what upstream of that tag could have moved it, which is the part you actually need.
You’ll use this again in exercise 5, where the troubleshooting agent queries a knowledge graph to narrow a fault to the equipment that could plausibly explain it.
03Find faults and diagnose their causes
IntermediateInvestigate a simulated tank using process context, trend plots, and calculated evidence.
 Open full size
 Open full size
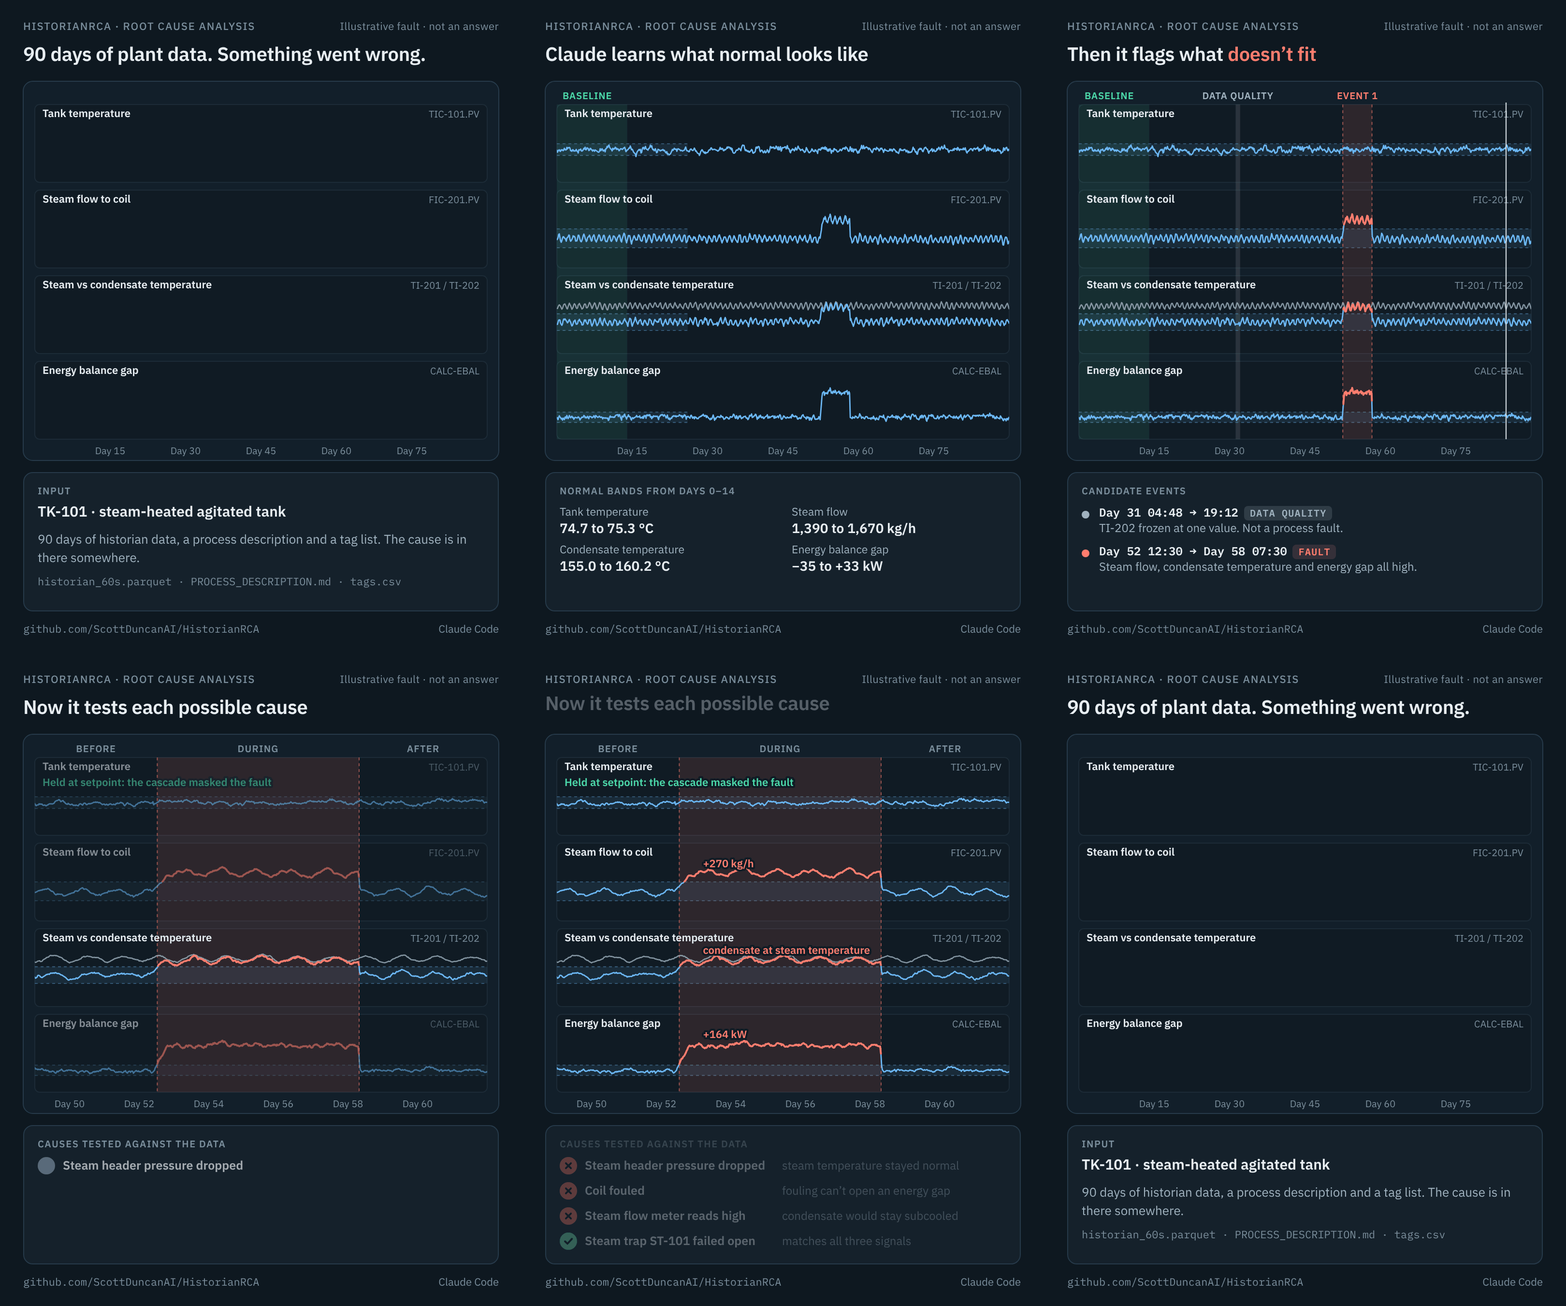
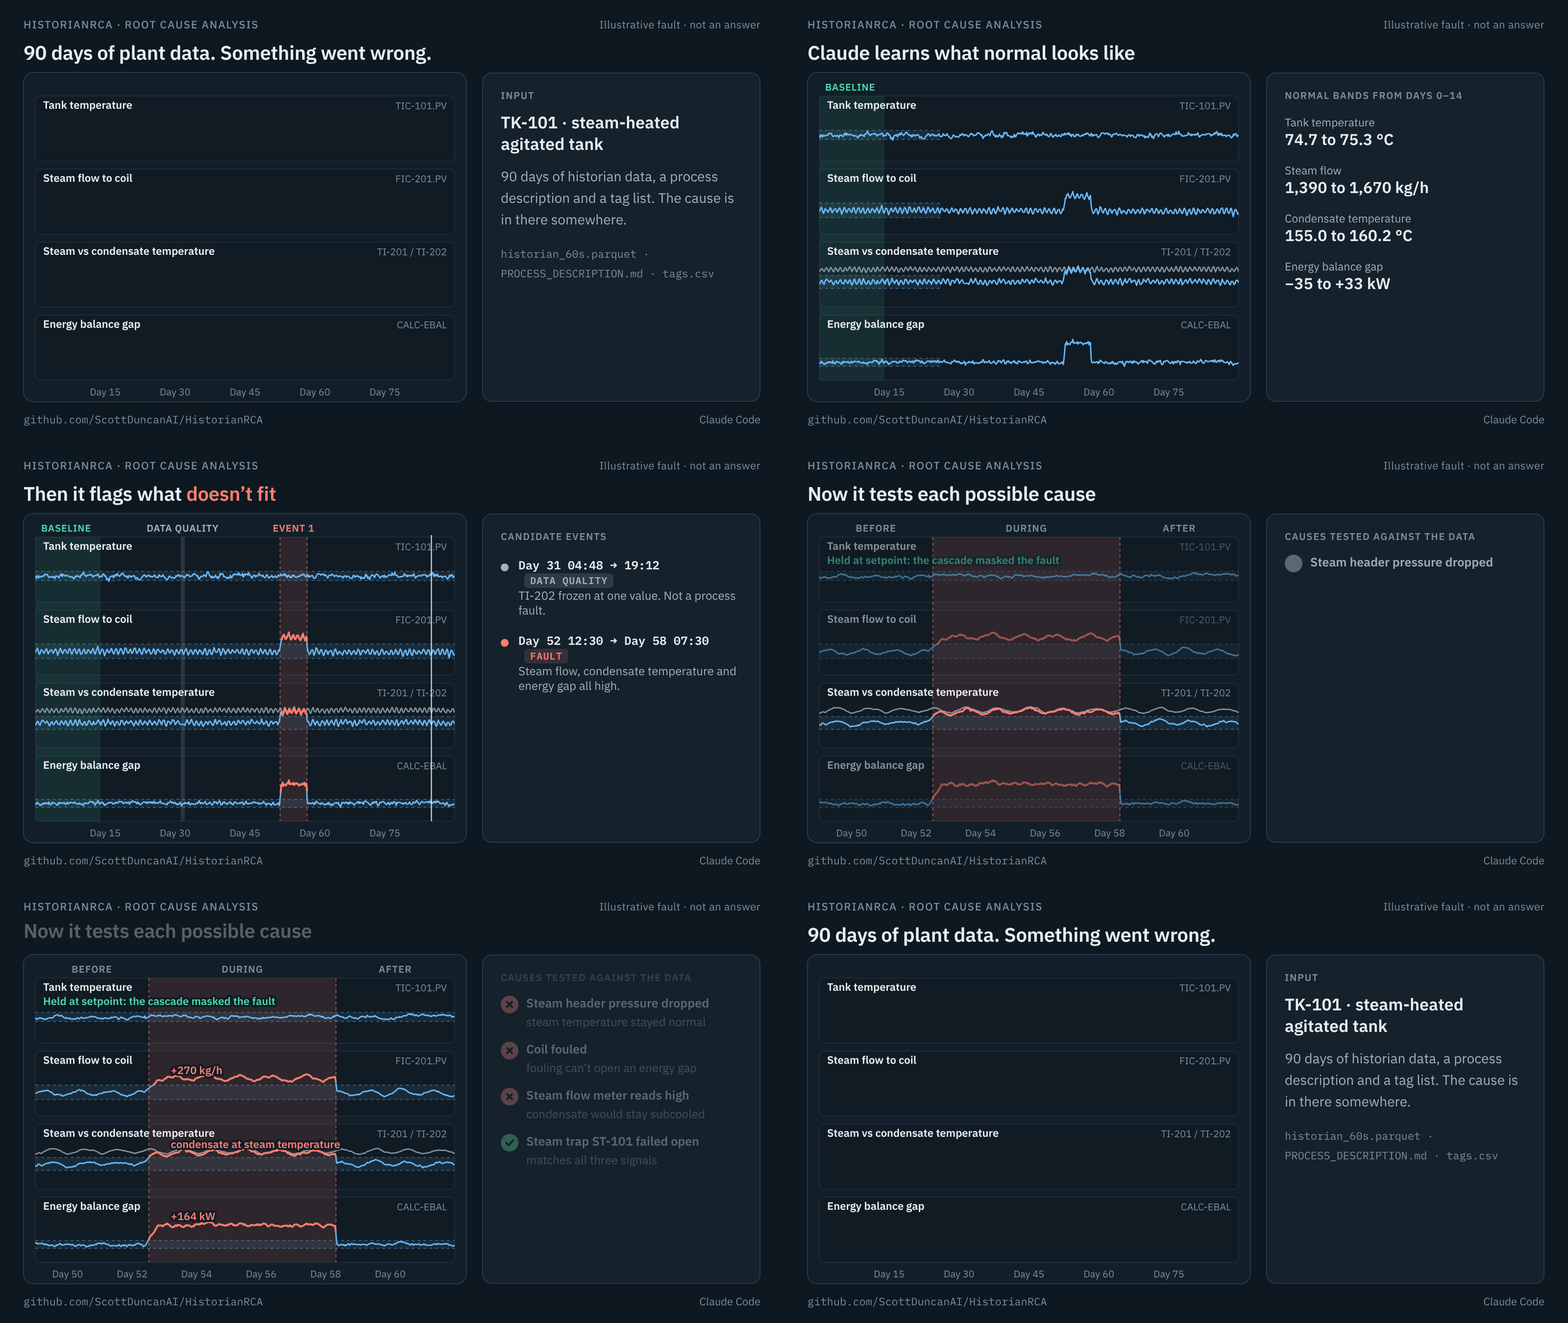
What we’ll do: use AI to find abnormal events and investigate their causes in HistorianRCA, a practice dataset I created. It contains 90 days of simulated data from a continuous, steam-heated, agitated tank with temperature and level control, plus a process description and tag list.
What you’ll get: a short investigation report with event timing, supporting plots, and likely root causes.
Key new terms
Context: background information AI needs to interpret your data. Here, it’s the process description, tag list, and investigation instructions. Claude uses this context to write and run analyses, then investigate possible causes.
- Download HistorianRCA. Open the GitHub repository, click Code → Download ZIP, and extract it. Open the extracted folder in Claude Code.
- Give Claude the process context. Type:Understand the dataset · Paste into Claude Code
Read PROCESS_DESCRIPTION.md, CHALLENGE.md, and tags.csv. Summarize the process and identify the signals we should analyze.
- Find candidate events. Type:Find abnormal periods · Paste into Claude Code
Analyze historian_60s.parquet for abnormal events, using the first 14 days as a normal baseline. Show the relevant trends and list candidate events with start and end times in UTC. Flag possible data-quality issues separately.
- Investigate one event. Start with the earliest candidate event that is not just a data-quality issue. Paste:Investigate the cause · Paste into Claude Code
Investigate the earliest candidate process fault in the event list you just created. State its start and end times. Compare conditions before, during, and after it. Test possible root causes against the data and process description. Show evidence for and against each explanation. Check short-lived features against historian.parquet, the primary record.
- Save the findings. Paste:For another investigation, ask Claude to repeat the analysis for the next candidate process fault in its list.Save the investigation · Paste into Claude Code
Save a report with the event timing, supporting plots, likely root cause, alternatives checked, and remaining uncertainty. Tell me where to open it.
Want a different dataset? Create your own with my time-series data simulator
- Download and extract HistorianSim. Follow the README’s Python setup and open the folder in Claude Code.
- Type
/simulatein Claude Code, then describe the process you want to simulate. - Use the generated dataset for a new investigation. Check your findings against the generated answer key.
04Build models that detect process faults
IntermediateCompare machine learning and PCA on Tennessee Eastman time-series data.
 Open full size
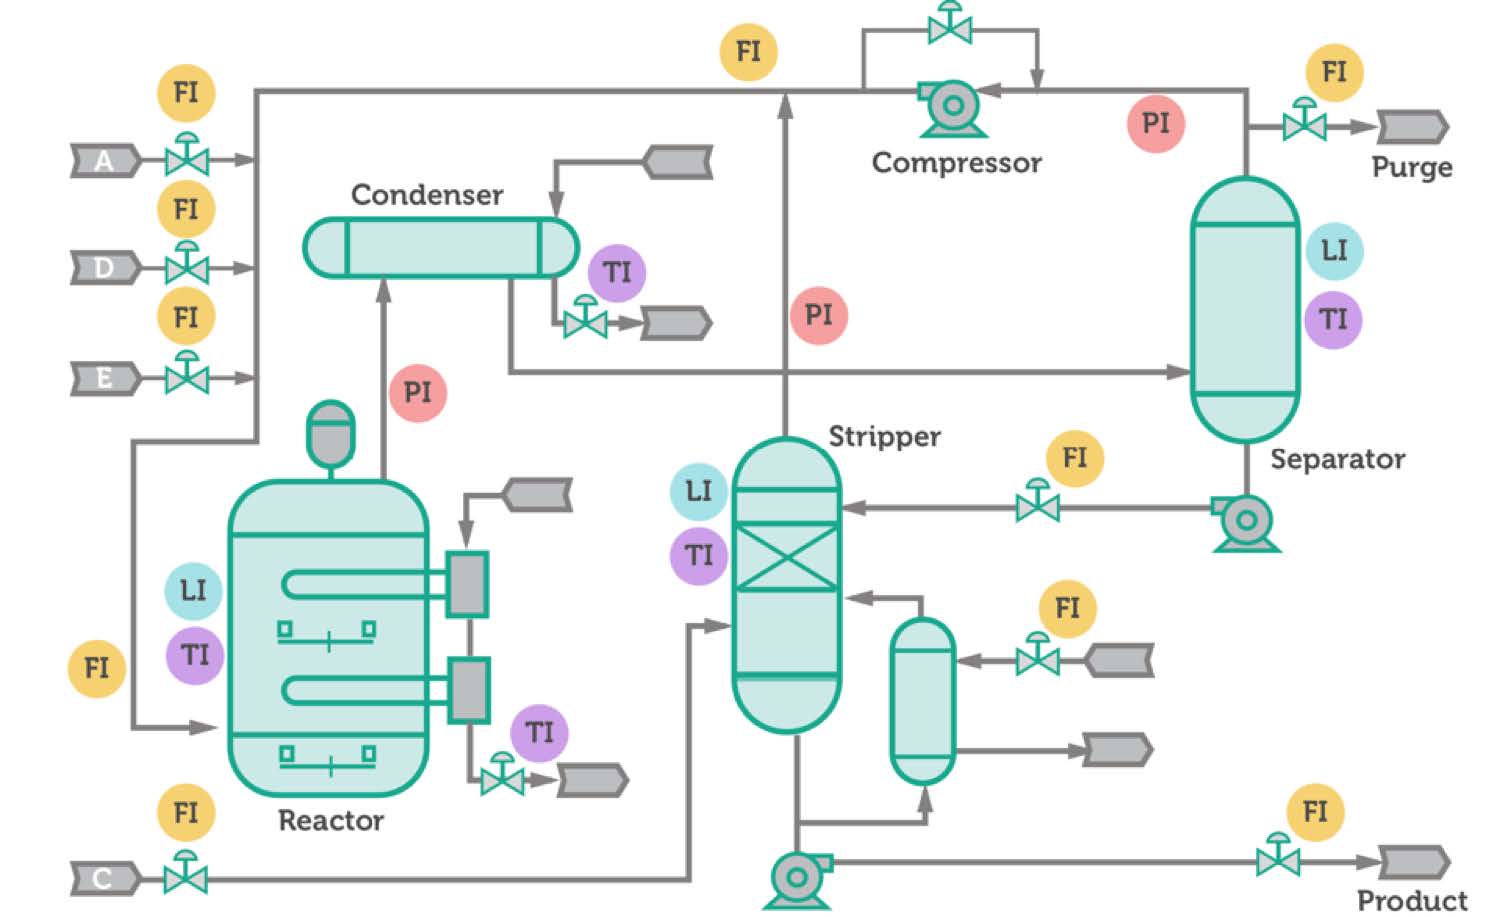
What we’ll do: use Plan Mode to have Claude plan four fault detectors (PCA, Logistic Regression, Random Forest, and XGBoost) for the Tennessee Eastman Process dataset. Then Claude builds them and compares their performance.
What you’ll get: four runnable models, fault-detection plots, and a recommendation backed by test results.
Key new terms
Tennessee Eastman Process (TEP) dataset: a simulated chemical plant from Eastman Chemical (1993), commonly used to benchmark fault detection algorithms. It logs 52 process variables every 3 minutes across a reactor, condenser, separator, compressor, and stripper. The data includes normal operation and 20 different faults. Learn more about the dataset.
Plan Mode: a Claude Code setting where Claude reads your files and researches the task, then writes a step-by-step plan for you to approve. It won’t change files or run code until you approve. Use it for bigger tasks so you can catch a wrong approach before any work is done.
PCA (Principal Component Analysis): summarizes patterns across related measurements. A PCA fault detector learns normal operation and flags departures from it.
Logistic Regression: a simple machine learning model that gives each measurement a learned weight and combines them into a probability that the process is in a fault state. It’s fast and easy to interpret, which makes it a useful baseline for judging whether more complex models are worth it.
Random Forest: a machine learning model that combines predictions from many decision trees trained on labeled examples.
XGBoost (Extreme Gradient Boosting): a machine learning method that adds decision trees in sequence, with each new tree helping correct earlier prediction errors.
Training vs. test data: training data builds the model. Separate test data measures how well it handles unseen examples.
Optional: watch the walkthrough. In this video, I walk through an earlier version of this exercise (three models, without Plan Mode). You can also refer to my example code.
- Download the data and open the folder. Download all four CSV files from the TEP dataset on Kaggle. Extract the download and put all four CSV files in one new folder named
tep-fault-detection. Open that folder in Claude Code. Kaggle may require sign-in. - Turn on Plan Mode. Press
Shift+Tabuntil the indicator below the prompt box shows plan mode. This usually takes two presses. - Ask Claude for a plan. Paste:Plan the models · Paste into Claude Code
I want to build a few different models that detect faults in the Tennessee Eastman Process (TEP) data in this folder, then compare how well they perform. Compare four models: PCA, Logistic Regression, Random Forest, and XGBoost. Create a plan to train each model on the TEP dataset, use it to detect faults, and compare the performance of all four. Keep entire simulation runs separate between training and testing, and use the test data only for the final comparison. Include installing any Python packages I need. Based on the results, recommend which model is best for this dataset and explain why. I’m new to machine learning, so explain the plan clearly and simply, and define any key terms.
- Answer Claude’s questions. Claude will likely ask you a few questions and give its recommendation for each. Choose the answer you prefer. If you’re unsure, go with its recommendation.
- Review the plan, then approve it. Read the plan Claude creates. Ask clarifying questions or request changes until it makes sense to you. When you’re happy with it, approve the plan and tell Claude to execute it.
- Review the results. When Claude finishes, open the comparison table and plots it saved. Check how many faults each model caught, how many false alarms it raised, and how quickly it detected each fault. If anything is unclear, paste:Explain the results · Paste into Claude Code
Explain these results in simple terms. Which model performed best, and why? Which faults were hardest to detect? How confident should I be in your recommendation, and what are its limits?
05Build an industrial troubleshooting agent
AdvancedLearn the architecture, then build your own assistant on HistorianRCA.
 Open full size
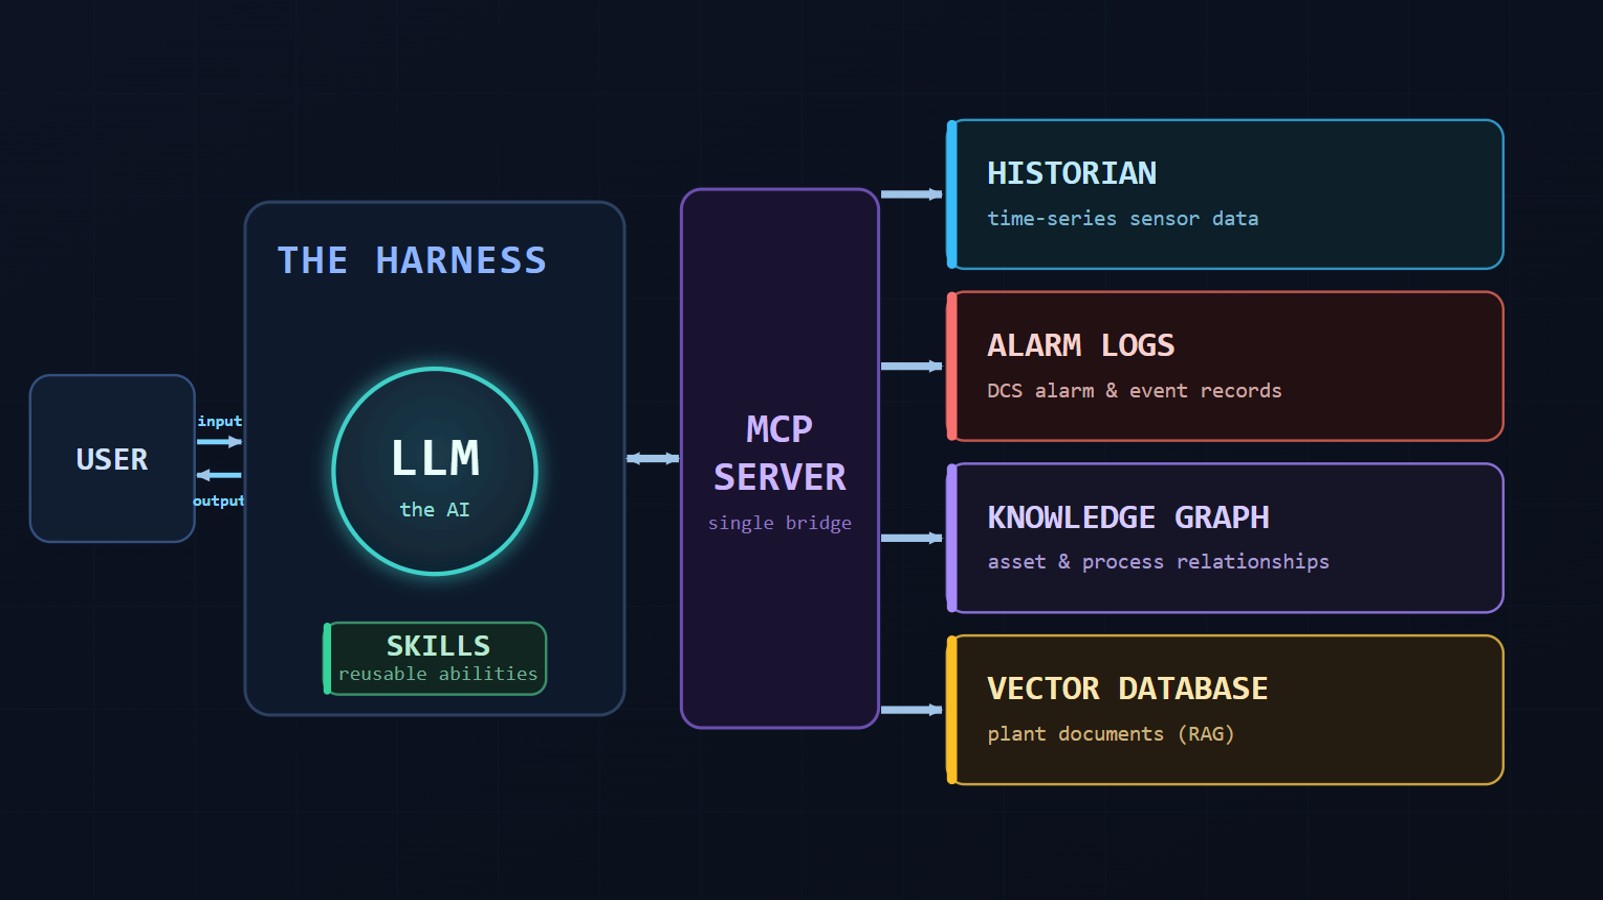
What we’ll do: run my existing troubleshooting assistant, learn how it uses tools, then build a smaller assistant for HistorianRCA, the tank dataset in exercise 3.
What you’ll get: an assistant that can look up tags, retrieve measurements, plot trends, and use that evidence to investigate a question.
Key new terms
Agent: an AI that works through a task step by step. It decides what information it needs, uses tools to get it, and keeps going until it can answer the question. For example, it might pull historian data around a trip, then check the alarm log for the same time window.
Tool: a specific action the agent can take, like pulling data for selected tags over a time range or searching the alarm log. Each tool is a small piece of code, so the results come straight from your data.
MCP (Model Context Protocol): a standard way to connect AI to tools and data sources. My MCP server gives Claude 23 tools across historian data, alarm logs, a knowledge graph, and plant documents.
RAG (Retrieval-Augmented Generation): the AI searches your documents for the sections relevant to a question, then uses them in its answer. My example searches 62 plant documents, including SOPs, equipment datasheets, and troubleshooting guides.
Knowledge graph: a structured map of items and their relationships, such as which instrument measures a tank’s temperature.
- Watch the build video. Follow the from-scratch walkthrough to see how the assistant connects to its data sources.
- Run the example. Open the agent repository, click Code → Download ZIP, and extract it. Follow the README’s Python 3.11+ setup, then open the folder in Claude Code. Type
/setupin Claude Code and restart when prompted. Paste:Try an investigation · Paste into Claude CodeWhy did steam temperature drop below 530 F on March 29?
- Understand the architecture. Paste:See how the agent works · Paste into Claude Code
Analyze this boiler troubleshooting agent’s architecture. Explain how Claude connects to the MCP tools, how those tools access the data, and how the agent records evidence. Use one data query from our investigation to show the flow from question to result.
- Build your HistorianRCA agent. Create a new folder named
historianrca-agent. Download and extract HistorianRCA, then copy its data and documentation files into that folder. Copy the boiler agent folder from step 2 into it as a subfolder namedboiler-reference. Openhistorianrca-agentin Claude Code and paste:Build using the boiler agent as a reference · Paste into Claude CodeAnalyze the architecture and implementation of the boiler troubleshooting agent in boiler-reference. Use it as a reference to build a new troubleshooting agent for the HistorianRCA files in this project. Reuse its approach to MCP tools, data access, and evidence-backed investigations, adapting it to the tank dataset and available documentation. Start with tools to look up tags, query time ranges, and plot trends. Explain what you will reuse or change, then build the agent and walk me through setup. Keep the reference files unchanged.
- Test your assistant. Paste:Compare the returned values with the dataset and investigate an event you reviewed in exercise 3.Check the tools · Paste into Claude Code
Choose the tank temperature tag from tags.csv, show its units, and plot the first full day of available data. Show the underlying records so I can verify the output. Then identify the earliest candidate process fault after the first 14 days and investigate its likely cause using the process description and data.
Use the public examples while you learn. Get company approval before using plant data, and review AI-generated diagrams and analyses before relying on them.